To use Google Analytics for an event, add a GA4 Google tag to your event website. Then track a short list of actions: page views, registration clicks, and ticket purchases. Use Google's recommended event names where they fit, test them in DebugView, and mark the ones that matter as key events. You can do all of it in an afternoon, and it tells you which promotion channels actually sell tickets.
This guide is for organizers, not analysts. It covers what a GA4 event is, which events an event site needs, two ways to set them up, how to test them, and what to do when ticketing happens on a page you do not control.
TL;DR
- A GA4 event is any recorded interaction, from a page load to a purchase. Event count is how many times it fired in a given period.
- Track five things for an event: visits to the event page, clicks on the ticket button, sign-ups, purchases, and merchandise or add-on sales.
- Use Google's recommended events such as
purchase,sign_upandgenerate_leadbefore inventing custom ones. - Install through the Google tag or Google Tag Manager, then verify in Realtime and DebugView before you promote anything.
- Mark
purchaseor your main sign-up event as a key event, and keep campaign links tagged so you can see which channel produced each sale.
Table of Contents
- What an event means in GA4
- The four kinds of GA4 events
- Which events an event website should track
- Setting up GA4 events step by step
- Testing before you promote
- Reading the results
- Mistakes that distort event data
- When ticketing happens on another page
- Our perspective
- Build the event site first, then measure it
- A simple measurement plan you can copy
- FAQ
- Sources
What an event means in GA4
In Google Analytics 4, an event is a specific interaction or occurrence on a website or app. Google defines it broadly: a page load, a link click, a purchase, or even a system behavior such as an app crash. Everything GA4 reports is built from events, which is a change from older versions of Analytics, where page views and events were separate things.
For an organizer, this means one simple idea. Each thing a visitor does on your event page can be counted, and the count is called the event count. Event count is the total number of times an event was triggered within the date range you are looking at. If 400 people clicked your "Get tickets" button and 60 of them bought, the click event count is 400 and the purchase event count is 60.
That gap between 400 and 60 is where the useful questions start. Was the checkout confusing? Did the price surprise people? Did one campaign send curious browsers while another sent buyers? Events let you answer those with numbers instead of guesses.

The four kinds of GA4 events
GA4 sorts events into four groups, and knowing which is which saves you from building things you do not need. Google's developer documentation lists automatically collected, enhanced measurement, recommended, and custom events.
| Event type | Who sets it up | Event site example |
|---|---|---|
| Automatically collected | Nobody. It fires once the tag is installed. | first_visit, session_start, user_engagement |
| Enhanced measurement | You switch it on in the data stream settings. | Scrolls, outbound link clicks, file downloads |
| Recommended | You implement it, using Google's names and parameters. | purchase, sign_up, generate_lead |
| Custom | You define the name and parameters. | A click on a "Add parking pass" button |
Automatically collected events, such as first_visit, session_start and user_engagement, occur by default once the GA4 tag is in place. Recommended events are different: they have predefined names and parameters that unlock specific reports, and you must implement them yourself.
Why custom events come last
It is tempting to name events whatever makes sense to you, like ticket_btn_click. The catch is that custom events do not appear in most standard reports. Google's own advice is to create a custom event only when no automatically collected or recommended event fits, because existing events populate the dimensions and metrics that reports already use.
A practical rule: if Google has a name for it, use that name.
Which events an event website should track
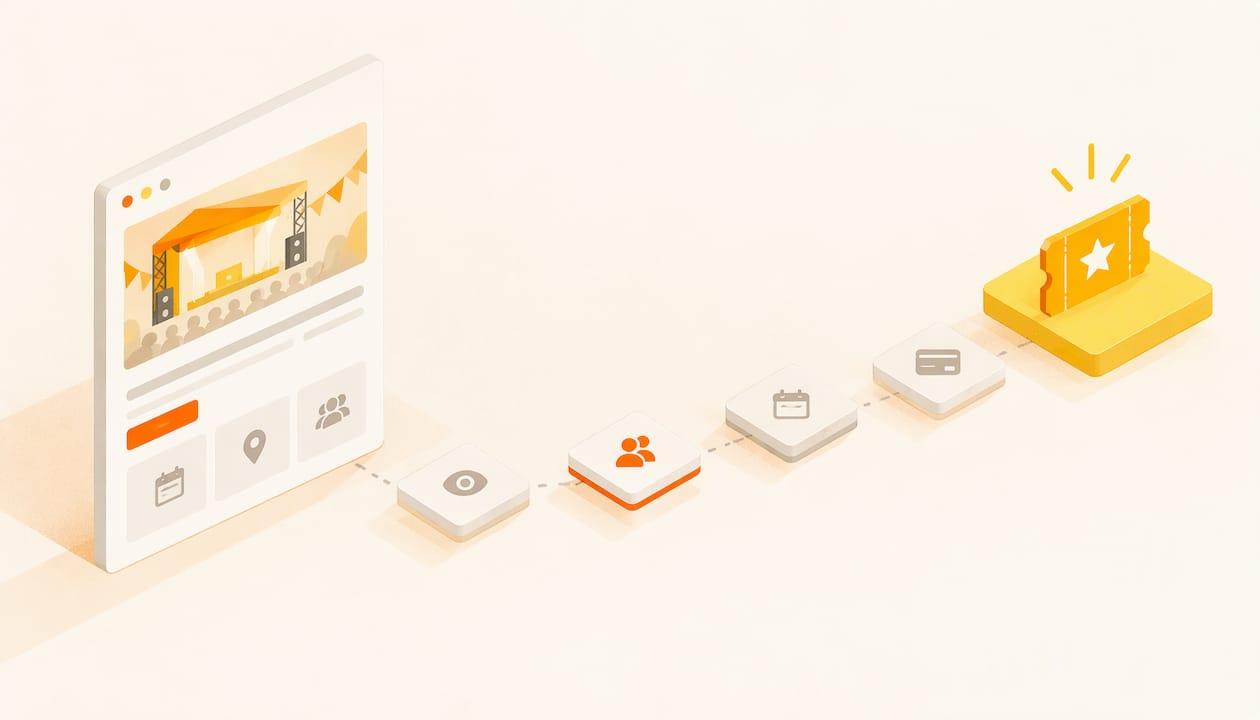
You do not need fifty events. You need the handful that describe the path from "someone heard about it" to "someone is coming."
1. Event page views
This comes free. GA4 records page views once the tag is installed, so you can see how many people reached your event page and where they came from. Compare weeks to see whether a social post, an email or a poster QR code moved the number.
2. Ticket button clicks
A click on "Get tickets" is the moment of intent. If your ticket button opens a different domain, GA4's outbound click tracking under enhanced measurement can capture it. If you want the click labeled as an interest signal in your own terms, a custom event is reasonable here, since no recommended event is an exact match.
3. Sign-ups and leads
For free events, RSVPs, workshop registrations and newsletter sign-ups, use sign_up or generate_lead. Google lists both among its recommended events, and using the prescribed names means the data flows into reports and suggested audiences without extra work. Pick one name per action and use it everywhere.
4. Ticket purchases
Use purchase with its prescribed parameters, such as value, currency and a transaction ID. This is the event that tells you what your promotion earned. It is also the one most worth marking as a key event, which we cover below.
5. Merchandise and add-ons
If you sell shirts, programs, parking passes or raffle entries alongside tickets, the same purchase event can carry the items. Keeping tickets and merchandise inside one purchase structure makes it easy to see what share of revenue each produces.
If you want a wider view of tracking sales beyond analytics, including the numbers to check daily as an event approaches, our guide on how to track ticket sales covers the practical side.
Setting up GA4 events step by step
There are two main ways to send events. Google's documentation says you can use the Google tag (gtag.js) or Google Tag Manager to implement events, configuring tags and triggers.
Step 1: Create a GA4 property and web data stream
In Google Analytics, create a property for the event and add a web data stream with your event site's address. You will receive a measurement ID that starts with "G-". Make a separate property, or at least a clearly named data stream, for each event or season so the numbers do not blur together year to year.
Step 2: Install the Google tag
Paste the tag snippet into your site's header, or use whatever field your website builder provides for a tracking ID. Once installed, the automatically collected events begin to appear.
Step 3: Switch on enhanced measurement
In the data stream settings, review the enhanced measurement toggles. For most event pages, scrolls, outbound clicks and file downloads (a PDF schedule, for example) are useful. Leave the ones you do not need switched off, so your reports stay readable.
Step 4: Add your recommended events
Choose between two routes:
- gtag.js: your developer, or you if you are comfortable with code, adds an event call at the moment the action happens, for example when a registration form is submitted.
- Google Tag Manager: you create a tag for the GA4 event, then a trigger such as a click on the ticket button or a view of a "thank you" page. This route suits organizers without a developer, because changes happen in a dashboard and not in the site's code.
Whichever you use, keep a simple tracking plan in a spreadsheet: event name, what triggers it, parameters sent, and who owns it. When a volunteer takes over next year, the plan is the handover.
Step 5: Tag your campaign links
Events tell you what people did. Campaign tags tell you what brought them. Add UTM parameters to links in emails, social posts and partner newsletters so a purchase can be traced back to the channel. Our guides on event email marketing and Instagram event promotion show where those links usually go.
Testing before you promote
Never launch a campaign on untested tracking. Two tools in GA4 do the checking, and Google describes both: Realtime and DebugView.
- Realtime shows how many times each event was triggered in the last 30 minutes. Open your event page in another tab, click the ticket button, and watch the count move.
- DebugView is built to verify an implementation. It shows each event as it arrives, with its parameters, so you can confirm that
purchasecarries a value and a currency.
Run the full journey yourself once: arrive from a tagged link, click through, register or buy. Then confirm every step shows up with the right name. If you use Tag Manager, its preview mode shows which tags fired on each click.
Reading the results
After a day or two, open the Events report. It shows how many times each event was collected for the selected date range, and the detailed view includes parameters and user counts.
Mark key events
A key event is an action that matters to your success. Google records and surfaces it in reports so you can find it easily. For a ticketed event, mark purchase. For a free workshop, mark your registration event. Keep the list short, because if everything is a key event, nothing stands out.
Three questions worth asking weekly
- Which channel sends buyers, not just visitors? Compare purchases by source, not page views by source.
- Where does the path drop? If page views are high and ticket clicks are low, the page or the price needs work. If clicks are high and purchases low, look at checkout.
- Is the audience new? First-visit counts against returning visitors show whether you are reaching new people or the same mailing list.
A better page often fixes the first drop. Our piece on event website design covers layout and accessibility choices that help visitors reach the ticket button.
Mistakes that distort event data
Most bad GA4 numbers come from a short list of causes.
- Creating custom events that duplicate existing ones. Check automatically collected and recommended events first. Duplicates split your counts across two names.
- Sending too many parameters. Google notes that exceeding 25 parameters may cause the event value to be dropped and can lead to inconsistencies between client-side and server-side properties. Send what you will actually use.
- Late data. Analytics ignores event data that arrives more than 72 hours after the event was triggered. If you upload or batch data, send it promptly.
- Changing names mid-campaign. Renaming
sign_uptoregisterin week three leaves you with two half-reports. Decide first, then keep it. - Counting your own team. Staff clicking through the page during testing inflate the numbers. Exclude internal traffic once the test is done, or note the test dates.
When ticketing happens on another page
Many organizers sell tickets through a separate checkout domain. The tracking then has two halves: your event site, and the page where the sale completes. Here is how to think about it.
Link your domains. In GA4's data stream settings, the cross-domain measurement section lets you list the domains that should count as one visitor journey. Without it, a visitor who moves from your site to a checkout domain can look like a new user, and the original source of the sale may be lost. This only works if the other domain also runs your measurement ID, so you need a ticketing setup that lets you add your own tag.
Track the click, even if you cannot track the purchase. If you cannot add your tag to the checkout page, the outbound click on your ticket button still tells you how many people showed intent from each channel. Pair it with the sales report from your ticketing dashboard to estimate conversion.

Consent matters. If visitors from the European Economic Area reach your event site, Google's guidance on consent signals applies. Analytics may notify you if it is not receiving affirmative consent signals for ads measurement or ads personalization, and its Consent settings page shows what share of your traffic comes from the EEA. If you advertise outside the US, set up a consent banner and check that page. Rules differ by country and state, so ask a privacy professional or your local regulator about your specific audience.
Our perspective
Analytics should serve the organizer, not the other way around. Most community events we see do not need a dashboard of fifty numbers. They need to know which post sold tickets and where buyers gave up.
That is why we built Actickety around a simple idea: your event, your revenue, your rules. You build the microsite in ten straightforward steps, you keep 100% ownership of your event data, and ticket sales carry no platform fees. Data you own is data you can analyze however you like, year after year, instead of having it locked inside someone else's marketplace.
Our advice is to track little and act often. Pick five events, test them, tag your campaign links, and check them every week while tickets are on sale. A small, clean set of numbers beats a large, confusing one.
Tim
Build the event site first, then measure it
Analytics needs something to measure. If you are still deciding where the event lives online, Actickety lets you build a professional event microsite, generate AI posters, and set up ticketing and merchandise with zero upfront costs until you are ready to go live. There are no platform fees on ticket sales, and you keep full control of your event data, which is what makes tracking worthwhile in the first place.

See how it works on the Actickety site, or read the terms of the event ticketing platform before you start. If your event is a community gathering, our guide to community event ticketing walks through launching in hours.
A simple measurement plan you can copy
Here is a plan that fits a charity gala, a school fair, a concert or a club tournament. Adjust the names to your event.
| Stage | What you want to know | Event to use | Where to look |
|---|---|---|---|
| Awareness | Did people reach the page? | Page views (automatic) | Reports, traffic by source |
| Interest | Did they head toward tickets? | Ticket button click (custom or outbound click) | Events report |
| Commitment | Did they register? | sign_up or generate_lead | Key events |
| Revenue | Did they pay? | purchase | Key events, with value |
| Add-ons | Did they buy extras? | purchase items | Event details |
Run it on a schedule. Check Realtime after you publish each campaign. Check the Events report weekly. Do a short review after the event, noting which channel produced the most purchases, and put that note in your plan for next year. If you are building the promotion calendar itself, the event marketing plan timeline is a good companion, and the event planning workflow places the review phase where it belongs.
FAQ
Is Google Analytics free to use for an event?
Google Analytics offers a free standard version that most organizers can use for an event website. You create a property, add a web data stream and install the tag. Check Google's current terms and limits when you set up, since they can change.
What is the difference between an event and a key event in GA4?
An event is any recorded interaction, such as a page load or a click. A key event is an event you mark as especially important to your goals, such as a ticket purchase. Google surfaces key events in reports so they are easy to find.
Do I need Google Tag Manager to track events?
No. You can send events with the Google tag directly, but that usually needs code changes. Tag Manager lets you add tags and triggers from a dashboard, which suits organizers without a developer. Both methods are described in Google's event setup documentation.
Why is my event not showing in the report?
Start with Realtime and DebugView to see whether the event is firing at all. If it fires there but not in standard reports, it may be a custom event, which does not appear in most standard reports. Switching to a recommended event name often solves it.
Can I track ticket sales that happen on another website?
Yes, partly. You can always track the click that sends people there. To follow the visitor through to the sale, the checkout domain must run your measurement ID and your domains must be linked in cross-domain settings. Otherwise, compare your click counts with the sales report from your ticketing dashboard.
Sources
- [GA4] About events, Analytics Help
- [GA4] About events, Analytics Help (key events)
- Set up events, Google for Developers
- Custom events, Analytics Help
- [GA4] Recommended events, Analytics Help
- [GA4] Verify and update consent settings, Analytics Help
- Event Count: What It Is and How to Track It in GA4, DashThis